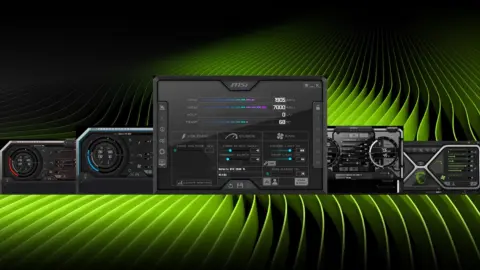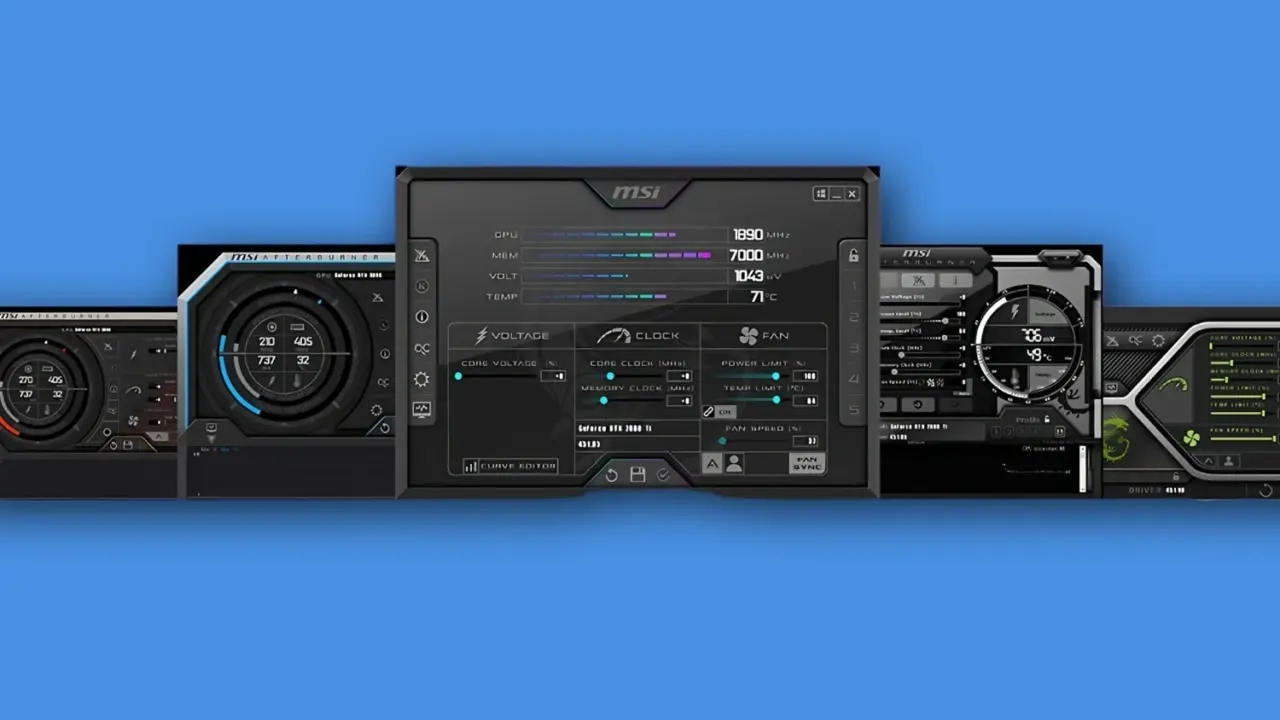
MSI Afterburner is adding a heatmap tool to help users optimize their GPU overclocking. This update targets the voltage and frequency curve editor, a critical area for performance tuning. The change matters because it visualizes how your graphics card behaves under load. Users can now see historical data points instead of guessing at optimal settings.
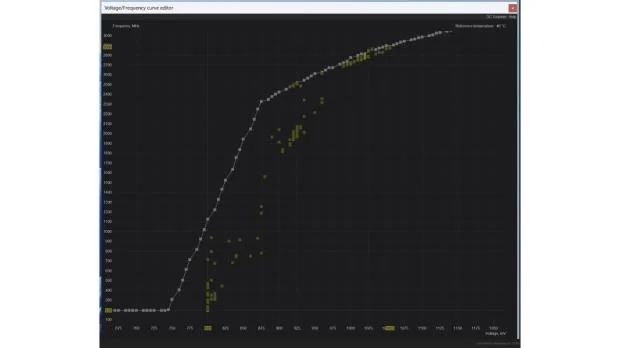
New beta tool tracks 256 voltage frequency curve positions
The new feature arrives in the upcoming v4.6.7 beta4 release of the software. It focuses on the V/F curve editor, which controls dynamic voltage frequency scaling. This editor allows users to adjust power delivery and clock speeds for better efficiency. The heatmap makes these adjustments easier to understand by showing usage patterns.
- New Feature: Heatmap for V/F curve editor
- Data Points Recorded: 256 historic V/F curve chart positions
- Target Version: v4.6.7 beta4
- Underlying Technology: DVFS (dynamic voltage frequency scaling)
The heatmap records and displays 256 historic V/F curve chart positions. This data helps users identify where their GPU spends most of its time. It highlights behavioral differences in newer hardware, such as the GeForce RTX 50 Series. These differences stem from changes in how the chips handle voltage and frequency scaling.
There is no confirmed date for when this feature will reach the official stable version. The update is currently expected only in the beta4 stage. Users who want to test the new visualization tool will need to install the beta. The developer, Unwinder, has not provided a timeline for the final release.
Source: TweakTown